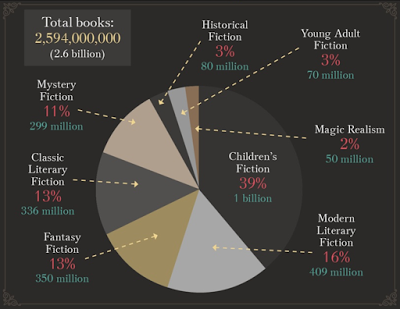
Aspiring writers often struggle to figure out the best way to create a career doing what they love. Using the NY Times best sellers list, I want to create visualizations that will help understand trends over time. Authors will be able to use this information to determine genre, themes, and target publishers.
Can following these trends guarantee that a book will hit the best seller’s list? There is a lot more to a book than title, publisher, and genre. This project can’t determine quality of writing or marketing strategies, but it should help to show trends in what is selling.
Another complication is determining what will be selling once your book is published, which could take years. The trend of this year could drop by the time your book hits the shelves, but a consistent trend could last a decade or more.
Sources
Erica Verillo’s article talks about which genre’s are the most popular and bring in the largest revenue. She also states that author’s should only write what they enjoy.
Ultimately, the writers who are the most successful have followed their own ideas, their own inspiration, their own muse.
Lauren Wise of Pressbook suggests that authors take a look at the world around them to choose their book’s theme. Certain themes are dying out while others are sliding in to popularity.
Action Plan
Get the data
- Find historical data on the NY Times best seller list
- Analyze the data to understand what it contains
- Clean data as needed
- Split out or group data into easily visualized dataframes
Visualize
- Use data in different visualizations to tell a story
- Determine what trends are being shown in the data
- Make visualization explanatory
Summarize
- Write up a conclustion of what was found
- Edit summary until it is clear and concise
- Publish to blog/portfolio
